# 目标检测指标VOC MAP的计算
# 1.MAP是什么
在目标检测任务中,MAP是对算法模型检测结果一个广泛使用的评判标准。MAP是Mean Average Precision,即在各个类别上的检测结果的平均精准率(AP,Average Precision)的平均,如果文字描述不清楚,下面看具体计算过程。理解MAP前需先弄明白平均精准率AP(Average Precision)、召回率Recall、精准率Precision、由Recall和Precision组成的PR曲线及曲线下面积AUC(Area Under the Curve)。
# 2.Recall/Precision/PR曲线/AUC和AP
二分类预测问题,对于某个具体样本的预测结果有两种,要么是预测正确,要么是预测错误。而预测正确又可细分为样本标签是正值预测为正值(TP,True Positive)、样本标签是负值预测为负值(TN,True Negative); 而预测错误的场景亦可细分为样本标签为正预测为负(FN,False Negative)、样本标签为负预测为正(FP,False Positive),如下表:
| 预测\标签 | 1 | 0 |
|---|---|---|
| 1 | TP | FP |
| 0 | FN | TN |
则Recall和Precision分别为:
Recall:召回率,即标签为正的样本有多少被预测为正

Precision:精准率,即预测为正的结果中有多少实际标签为正

对于目标检测任务,在所有的测试数据上,可以得到具体某个类别目标的预测框,得到预测框后与测试数据的标签框进行比对,可以计算取不同置信度阈值时,当前类别对应的精准率Precision和召回率Recall,记录对应的数据以Precision为纵轴,Recall为横轴即可画出对应的Precision-Recall曲线。下面通过1个例子来说明。

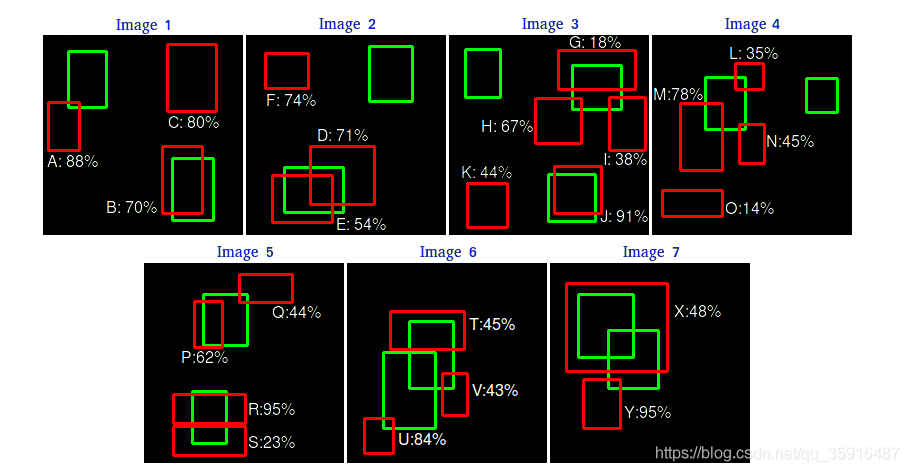
图中有7个图像,绿色框表示图像中某个类对象目标的标签框(15个),红色表示此类别在7张图像上目标的预测框(24个),预测框列表如下:
表格1
| Images | Prediction BBox | Confidence | IOU |
|---|---|---|---|
| image1 | A | 88% | 0.05 |
| image1 | B | 70% | 0.80 |
| image1 | C | 80% | 0.00 |
| image2 | D | 71% | 0.42 |
| image2 | E | 54% | 0.83 |
| image2 | F | 74% | 0.00 |
| image3 | G | 18% | 0.54 |
| image3 | H | 67% | 0.05 |
| image3 | I | 38% | 0.06 |
| image3 | J | 91% | 0.91 |
| image3 | K | 44% | 0.00 |
| image4 | L | 35% | 0.08 |
| image4 | M | 78% | 0.15 |
| image4 | N | 45% | 0.06 |
| image4 | O | 14% | 0.00 |
| image5 | P | 62% | 0.62 |
| image5 | Q | 44% | 0.04 |
| image5 | R | 95% | 0.68 |
| image5 | S | 23% | 0.21 |
| image6 | T | 45% | 0.35 |
| image6 | U | 84% | 0.03 |
| image6 | V | 43% | 0.06 |
| image7 | X | 48% | 0.68 |
| image7 | Y | 95% | 0.08 |
IOU是什么怎么求的?可以看这里
A-V和X,Y即算法输出的7张图像中目标的预测框,输出的检测框也即预测检测结果包含目标对象,也即都是Position Prediction,当然其中包括了 预测正确的 True Positive(TP)和 预测错误的False Positive(FP)。检测结果的最终输出还需根据IOU来判断,选取某个IOU阈值,大于当前IOU阈值的预测正确为TP,否则预测错误为FP。这里选定IOU阈值为0.5进行判断可得表格2。
表格2
| Images | Prediction BBox | Confidence | IOU | IOU大于阈值 | TP/FP |
|---|---|---|---|---|---|
| image1 | A | 88% | 0.05 | 否 | FP |
| image1 | B | 70% | 0.80 | 是 | TP |
| image1 | C | 80% | 0.00 | 否 | FP |
| image2 | D | 71% | 0.42 | 否 | FP |
| image2 | E | 54% | 0.83 | 是 | TP |
| image2 | F | 74% | 0.00 | 否 | FP |
| image3 | G | 18% | 0.54 | 是 | TP |
| image3 | H | 67% | 0.05 | 否 | FP |
| image3 | I | 38% | 0.06 | 否 | FP |
| image3 | J | 91% | 0.91 | 是 | TP |
| image3 | K | 44% | 0.00 | 否 | FP |
| image4 | L | 35% | 0.08 | 否 | FP |
| image4 | M | 78% | 0.15 | 否 | FP |
| image4 | N | 45% | 0.06 | 否 | FP |
| image4 | O | 14% | 0.00 | 否 | FP |
| image5 | P | 62% | 0.62 | 是 | TP |
| image5 | Q | 44% | 0.04 | 否 | FP |
| image5 | R | 95% | 0.68 | 是 | TP |
| image5 | S | 23% | 0.21 | 否 | FP |
| image6 | T | 45% | 0.35 | 否 | FP |
| image6 | U | 84% | 0.03 | 否 | FP |
| image6 | V | 43% | 0.06 | 否 | FP |
| image7 | X | 48% | 0.68 | 是 | TP |
| image7 | Y | 95% | 0.08 | 否 | FP |
将上述表格中的数据根据Confidence进行排序,可得如下表格3如下:
表格3
| Images | Prediction BBox | Confidence | IOU | IOU大于阈值 | TP/FP |
|---|---|---|---|---|---|
| image5 | R | 95% | 0.68 | 是 | TP |
| image7 | Y | 95% | 0.08 | 否 | FP |
| image3 | J | 91% | 0.91 | 是 | TP |
| image1 | A | 88% | 0.05 | 否 | FP |
| image6 | U | 84% | 0.03 | 否 | FP |
| image1 | C | 80% | 0.00 | 否 | FP |
| image4 | M | 78% | 0.15 | 否 | FP |
| image2 | F | 74% | 0.00 | 否 | FP |
| image2 | D | 71% | 0.42 | 否 | FP |
| image1 | B | 70% | 0.80 | 是 | TP |
| image3 | H | 67% | 0.05 | 否 | FP |
| image5 | P | 62% | 0.62 | 是 | TP |
| image2 | E | 54% | 0.83 | 是 | TP |
| image7 | X | 48% | 0.68 | 是 | TP |
| image4 | N | 45% | 0.06 | 否 | FP |
| image6 | T | 45% | 0.35 | 否 | FP |
| image3 | K | 44% | 0.00 | 否 | FP |
| image5 | Q | 44% | 0.04 | 否 | FP |
| image6 | V | 43% | 0.06 | 否 | FP |
| image3 | I | 38% | 0.06 | 否 | FP |
| image4 | L | 35% | 0.08 | 否 | FP |
| image5 | S | 23% | 0.21 | 否 | FP |
| image3 | G | 18% | 0.54 | 是 | TP |
| image4 | O | 14% | 0.00 | 否 | FP |
从高到低取不同的置信度作为阈值分别计算对应的Precision和Recall,可得表格4,
表格4
| Images | Prediction BBox | Confidence | IOU | IOU大于阈值 | TP/FP | TP | FP | TP总计 | FP总计 | Precision | Recall |
|---|---|---|---|---|---|---|---|---|---|---|---|
| image5 | R | 95% | 0.68 | 是 | TP | 1 | 0 | 1 | 0 | 1/1=1 | 1/15=0.0667 |
| image7 | Y | 95% | 0.08 | 否 | FP | 0 | 1 | 1 | 1 | 1/2=0.5 | 1/15=0.0667 |
| image3 | J | 91% | 0.91 | 是 | TP | 1 | 0 | 2 | 1 | 2/3=0.6667 | 2/15=0.1333 |
| image1 | A | 88% | 0.05 | 否 | FP | 0 | 1 | 2 | 2 | 2/4=0.5 | 2/15=0.1333 |
| image6 | U | 84% | 0.03 | 否 | FP | 0 | 1 | 2 | 3 | 2/5=0.4 | 2/15=0.1333 |
| image1 | C | 80% | 0.00 | 否 | FP | 0 | 1 | 2 | 4 | 2/6=0.3333 | 2/15=0.1333 |
| image4 | M | 78% | 0.15 | 否 | FP | 0 | 1 | 2 | 5 | 2/7=0.2857 | 2/15=0.1333 |
| image2 | F | 74% | 0.00 | 否 | FP | 0 | 1 | 2 | 6 | 2/8=0.25 | 2/15=0.1333 |
| image2 | D | 71% | 0.42 | 否 | FP | 0 | 1 | 2 | 7 | 2/8=0.2222 | 2/15=0.1333 |
| image1 | B | 70% | 0.80 | 是 | TP | 1 | 0 | 3 | 7 | 0.3 | 0.2 |
| image3 | H | 67% | 0.05 | 否 | FP | 0 | 1 | 3 | 8 | 0.2727 | 0.2 |
| image5 | P | 62% | 0.62 | 是 | TP | 1 | 0 | 4 | 8 | 0.3333 | 0.2667 |
| image2 | E | 54% | 0.83 | 是 | TP | 1 | 0 | 5 | 8 | 0.3846 | 0.3333 |
| image7 | X | 48% | 0.68 | 是 | TP | 1 | 0 | 6 | 8 | 0.4285 | 0.4 |
| image4 | N | 45% | 0.06 | 否 | FP | 0 | 1 | 6 | 9 | 0.4 | 0.4 |
| image6 | T | 45% | 0.35 | 否 | FP | 0 | 1 | 6 | 10 | 0.375 | 0.4 |
| image3 | K | 44% | 0.00 | 否 | FP | 0 | 1 | 6 | 11 | 0.3529 | 0.4 |
| image5 | Q | 44% | 0.04 | 否 | FP | 0 | 1 | 6 | 12 | 0.3333 | 0.4 |
| image6 | V | 43% | 0.06 | 否 | FP | 0 | 1 | 6 | 13 | 0.3157 | 0.4 |
| image3 | I | 38% | 0.06 | 否 | FP | 0 | 1 | 6 | 14 | 0.3 | 0.4 |
| image4 | L | 35% | 0.08 | 否 | FP | 0 | 1 | 6 | 15 | 0.2857 | 0.4 |
| image5 | S | 23% | 0.21 | 否 | FP | 0 | 1 | 6 | 16 | 0.2727 | 0.4 |
| image3 | G | 18% | 0.54 | 是 | TP | 1 | 0 | 7 | 16 | 0.3043 | 0.4667 |
| image4 | O | 14% | 0.00 | 否 | FP | 0 | 1 | 7 | 17 | 0.2913 | 0.4667 |
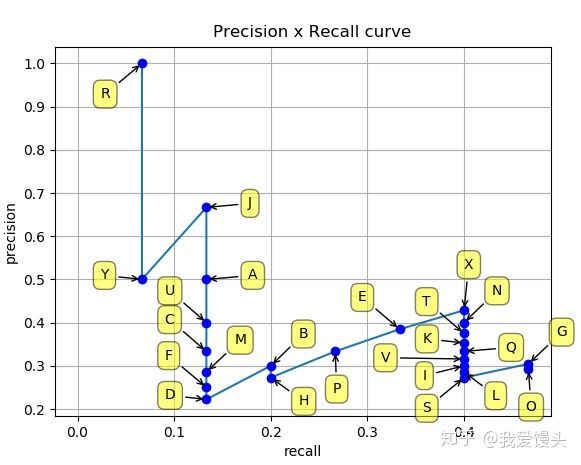
取表格4中的Precision和Recall可画出当IOU阈值0.5时的Precision-Recall曲线:

Average Precision(AP)即是P-R曲线下面积,

以上就是目标检测中某类别特定IOU阈值下AP的具体所指及其含义,各个类的AP求平均即可算得特定IOU下的mAP,不同的比赛采取不同的曲线下面积AUC近似计算策略,如PASCAL2007、COCO等。
# 3.AP的不同计算策略
- PASCAL VOC 2007
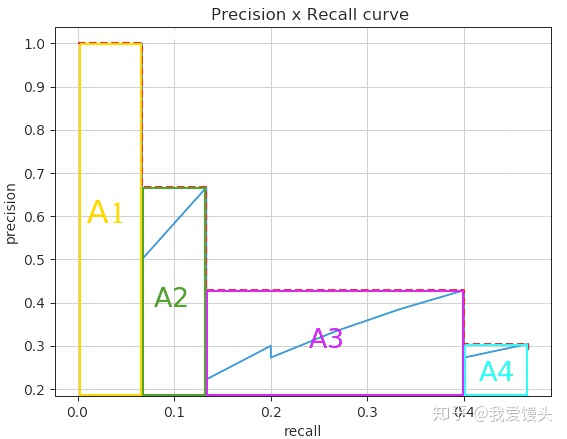
在PASCAL VOC 2007中,在计算AP之前会对上述曲线进行平滑,平滑方法为,对每一个Precision值,使用其右边最大的Precision值替代,具体示意图如下:
图3-1:PR曲线向右取precision最大值替代

平滑后,上面蓝色的PR曲线就变成了红色的虚线,平滑后的PR曲线变成了单调递减:
图3-2:PASCAL VOC 2007取[0:0.1:1]11个点计算AP

实际计算时,对平滑后的Precision曲线进行均匀采样出11个点(每个点间隔0.1),然后计算这11个点的平均Precision:

- PASCAL VOC 2007后
上述11点插值的办法由于插值点数过少,容易导致结果不准。一个解决办法就是内插所有点。所谓内插所有点,其实就是对上述平滑之后的曲线算曲线下面积。
图3-3:PASCAL VOC 2007后计算平滑后曲线下面积作AP

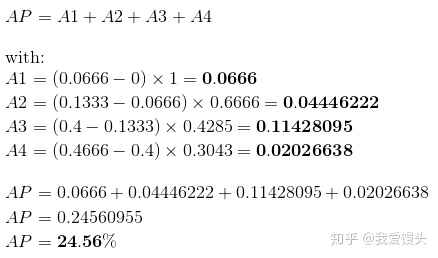
在上面的例子中:

- COCO
COCO中根据不同的IOU阈值计算了AP50、AP75等
且COCO中使用的是101个点对PR曲线做插值,得到的结果会更准确。
# 4.代码实现
- 计算
Precision和Recall
def get_precision_and_recall(detpath,
             annopath,
             imagesetfile,
             classname,
             cachedir,
             ovthresh=0.5):

    # read list of images
    with open(imagesetfile, 'r') as f:
        lines = f.readlines()
    imagenames = [x.strip() for x in lines]
    recs = {}
    for i, imagename in enumerate(imagenames):
        recs[imagename] = parse_rec(annopath.format(imagename))
    # extract all ground truth objects for current class
    class_recs = {}
    npos = 0
    for imagename in imagenames:
        R = [obj for obj in recs[imagename] if obj['name'] == classname]
        bbox = np.array([x['bbox'] for x in R])
        difficult = np.array([x['difficult'] for x in R]).astype(np.bool)
        det = [False] * len(R)
        npos = npos + sum(~difficult)
        class_recs[imagename] = {'bbox': bbox,
                                 'difficult': difficult,
                                 'det': det}

    # read detected bounding box
    detfile = detpath.format(classname)
    with open(detfile, 'r') as f:
        lines = f.readlines()

    splitlines = [x.strip().split(' ') for x in lines]
    image_ids = [x[0] for x in splitlines]
    confidence = np.array([float(x[1]) for x in splitlines])
    BB = np.array([[float(z) for z in x[2:]] for x in splitlines])

    # sort by confidence
    sorted_ind = np.argsort(-confidence)
    sorted_scores = np.sort(-confidence)
    BB = BB[sorted_ind, :]
    image_ids = [image_ids[x] for x in sorted_ind]

    # go down dets and mark TPs and FPs
    # judge whether the bb is correct for every bb
    # in the corresponing img
    nd = len(image_ids)
    tp = np.zeros(nd)
    fp = np.zeros(nd)
    for d in range(nd):
        R = class_recs[image_ids[d]]
        bb = BB[d, :].astype(float)
        ovmax = -np.inf
        BBGT = R['bbox'].astype(float)

        if BBGT.size > 0:
            # compute overlaps intersection(IOU)
            ixmin = np.maximum(BBGT[:, 0], bb[0])
            iymin = np.maximum(BBGT[:, 1], bb[1])
            ixmax = np.minimum(BBGT[:, 2], bb[2])
            iymax = np.minimum(BBGT[:, 3], bb[3])
            iw = np.maximum(ixmax - ixmin + 1., 0.)
            ih = np.maximum(iymax - iymin + 1., 0.)
            inters = iw * ih
            uni = ((bb[2] - bb[0] + 1.) * (bb[3] - bb[1] + 1.) +
                   (BBGT[:, 2] - BBGT[:, 0] + 1.) *
                   (BBGT[:, 3] - BBGT[:, 1] + 1.) - inters)

            overlaps = inters / uni
            ovmax = np.max(overlaps)
            jmax = np.argmax(overlaps)

        if ovmax > ovthresh:
            if not R['difficult'][jmax]:
                if not R['det'][jmax]:
                    tp[d] = 1.
                    R['det'][jmax] = 1
                else: # repeated predicition is fp
                    fp[d] = 1.
        else:
            fp[d] = 1.

    # compute precision recall
    fp = np.cumsum(fp)
    tp = np.cumsum(tp)
    rec = tp / float(npos)
    # avoid divide by zero in case the first detection matches a difficult
    # ground truth
    prec = tp / np.maximum(tp + fp, np.finfo(np.float64).eps)
    return prec,rec,
- 计算
Average Precision
def voc_ap(rec, prec, use_07_metric=False):
    """ ap = voc_ap(rec, prec, [use_07_metric])
    Compute VOC AP given precision and recall.
    If use_07_metric is true, uses the
    VOC 07 11 point method (default:False).
    """
    if use_07_metric: # 11 point metric
        ap = 0.
        for t in np.arange(0., 1.1, 0.1):
            if np.sum(rec >= t) == 0:
                p = 0
            else:
                p = np.max(prec[rec >= t])
            ap = ap + p / 11.
    else: # after 2007
        # correct AP calculation
        # first append sentinel values at the end
        mrec = np.concatenate(([0.], rec, [1.]))
        mpre = np.concatenate(([0.], prec, [0.]))

        # compute the precision envelope
        for i in range(mpre.size - 1, 0, -1):
            mpre[i - 1] = np.maximum(mpre[i - 1], mpre[i])

        # to calculate area under PR curve, look for points
        # where X axis (recall) changes value
        i = np.where(mrec[1:] != mrec[:-1])[0]
        # and sum (\Delta recall) * prec
        ap = np.sum((mrec[i + 1] - mrec[i]) * mpre[i + 1])
    return ap
可运行代码地址(两个地址同一个仓库,任选其一访问即可):
1.https://gitee.com/lx_r/object_detection_task.git
2.https://github.com/lxrobot/object_detection_task.git
(跑不起来的代码都是刷流氓^_^)