# Yolov2训练时anchor是如何使用的
# 0.简略描述
- 1.将真值检测框变换到特征图尺度上
- 2.计算以特征图每个网格中心为中心点时所有锚框与真值检测框的交并比
- 3.取与真值检测框交并比最大的锚框的id,及真值检测框中心所在cell的id,有此,可将真值检测框与预测结果对应起来
- 4.计算位置回归损失,置信度损失,分类损失
# 1.网络的输出
yolov2 网络对于检测框位置大小的输出是:

对于1个batch网络的输出的shape为[batch_size, H*W*num_anchors, 5+num_classes], 其中:
- num_anchors:指1个点处的anchor数量
- H,W分别是卷积得到的feature map的高宽
- 5 + num_classes,分别指{% mathjax %}
t_x
{% endmathjax %} 、{% mathjax %}t_y{% endmathjax %}、{% mathjax %}t_\omega{% endmathjax %}、{% mathjax %}t_h{% endmathjax %}及检测框的评分score
# 2.输出的处理
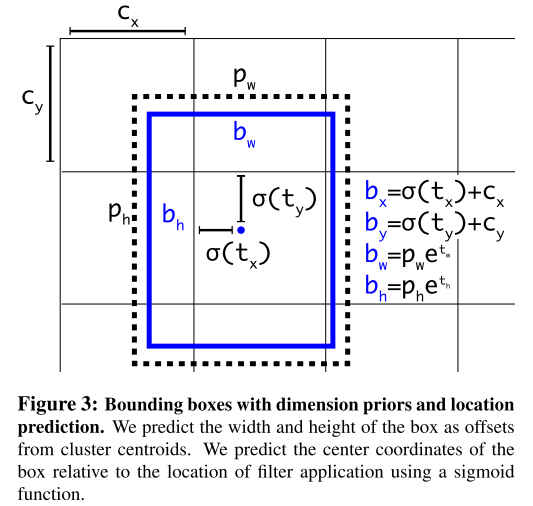
拿到网络的输出后,使用图1中的公式计算得到{% mathjax %}\sigma(t_x),\sigma(t_y),e^{t_\omega},e^{t_h}{% endmathjax %},再分别得到feature_map尺度上的所有{% mathjax %}c_x,c_y{% endmathjax %},根据不同anchors计算得每个预测点对应的检测框如下图:

裁切去超出的部分:

其中,pa11、pa21、pa31即在2x2的feature_map上的中心点落在cell1时对应的预测框,在本例中feature_map的H、W都为2,每个cell上分别有不同尺度的anchor3个,由此可得1张图像上的检测框共有HxWxnum_anchors个。
# 3.端到端训练loss的计算
同#1,#2中所讲,网络输出的shape为[batch_size,H*W*num_anchors, 5+num_classes],输出的内容是{% mathjax %}t_x,t_y,t_\omega,t_h,score,class_score{% endmathjax %}, yolov2的loss函数有3部分构成:
{% mathjax %}loss = loss_{coordination}+loss_{confidence}+loss_{classification}{% endmathjax %}
代码示例:
    box_loss = 1 / b * cfg.coord_scale * F.mse_loss(delta_pred_batch * box_mask, box_target * box_mask, reduction='sum') / 2.0
    iou_loss = 1 / b * F.mse_loss(conf_pred_batch * iou_mask, iou_target * iou_mask, reduction='sum') / 2.0
    class_loss = 1 / b * cfg.class_scale * F.cross_entropy(class_score_batch_keep, class_target_keep, reduction='sum')

这里比较关键的一点,网络的输出是H*W*num_anchors个预测结果,且预测的anchor锚框的的偏移量。检测训练数据中,标签文件是ground truth box的中心点和宽高归一化后的坐标,且ground truth box(gt box)的数量远小于预测数H*W*num_anchors,如何将gtbox与预测的结果对应起来呢?如上图,如何确定是cell1中的pa11负责预测图中的小人呢?这里有个anchor assignment的过程,在yolo源码中有一个函数build_target正是处理gt box与预测结果之间的对应。
其映射过程如下,首先将gt box和anchor都乘上[W,H]变换到feature map尺度上,计算可得gt box与H*W*num_anchors个anchor锚框之间的IOU,计算gt_box与anchors之间的IOU时分别取特征图每个cell的中心,得
overlaps = box_ious(all_anchors_xxyy, gt_boxes).view(-1, num_anchors, num_obj)
然后确定gt box中心落在feature map哪个cell中,根据{% mathjax %}c_x,c_y{% endmathjax %}可求得:
cell_idx_x, cell_idx_y = torch.floor(gt_box_xywh[:2])
据此求得gt box的中心在哪个cell,结合上面已求出的IOU得到每个gt box与该cell中每个anchor的IOU,其最大者即负责预测当前gt_box
cell_id = cell_idx_x*W+cell_idx_y
overlaps_in_cell = overlaps[cell_id, :, t]
argmax_anchor_idx = torch.argmax(overlaps_in_cell)

上图中,gt_box时检测小人的检测框,其中心落在cell1中,且计算可知其与anchor锚框ta11的IOU最大,故cell1中的ta11负责预测gt_box。
找到gt box对应的cell和anchor后可根据图1反向计算得真值偏移量用以计算loss,在shape为[batch_size, H*W*num_anchors,5+num_class]的预测中除cell_id,argmax_anchor_idx对应的预测框外,其他对预测结果无用,边框回归和分类评估时都直接忽略(使用mask=0抑制),计算confidence将其目标计为0。