# sklearn.metrics.classification_report中的Micro/Macro/Weighted Average指标
# 1.classification_report
sklearn.metrics.classification_report输出分类预测结果的常用评估标准,输入是标签和类别的预测向量,包括精准度,召回率和F1 Score。
借用1个例子来说明一下计算过程。原例子见:
https://towardsdatascience.com/micro-macro-weighted-averages-of-f1-score-clearly-explained-b603420b292f
数据为:
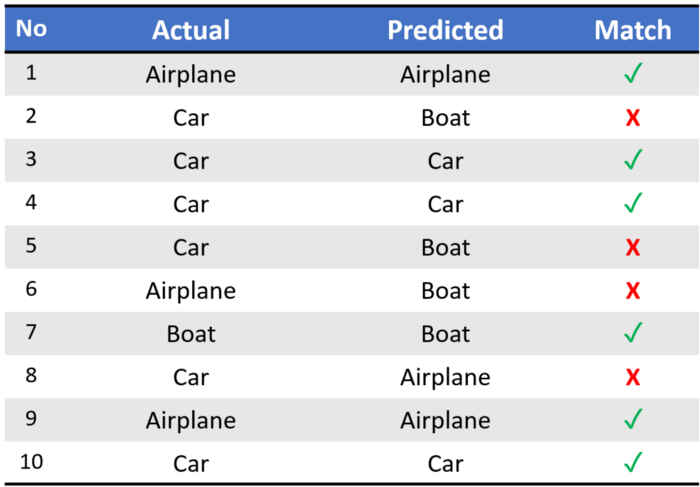
from sklearn.metrics import classification_report
import numpy as np
names = ["Airplane", "Boat", "Car"]
names.sort()
class_dict = dict([[v, i] for i,v in enumerate(names)])
# {'Airplane': 0, 'Boat': 1, 'Car': 2}
tru = np.array([0, 2, 2, 2, 2, 0, 1, 2, 0, 2])
pre = np.array([0, 1, 2, 2, 1, 1, 1, 0, 0, 2])
report = classification_report(tru, pre)
print(report)
输出结果为:
              precision    recall  f1-score   support

           0       0.67      0.67      0.67         3
           1       0.25      1.00      0.40         1
           2       1.00      0.50      0.67         6

    accuracy                           0.60        10
   macro avg       0.64      0.72      0.58        10
weighted avg       0.82      0.60      0.64        10
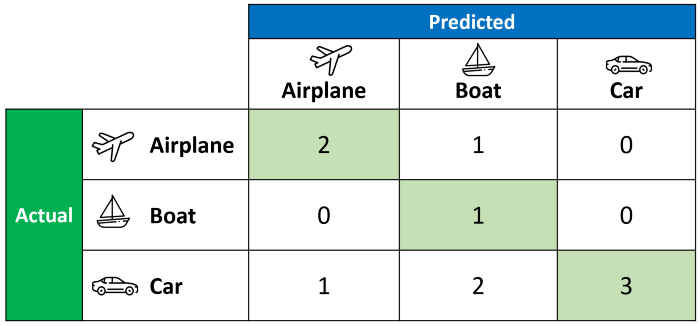
# 2.计算过程
上述预测结果对应的混淆矩阵为:
每个类别对应的TP(True Positive)\FP(False Negative)\FN(False Negative)为:

计算每个类别的Precision, Recall和F1 Score:

上述的结果对每个类别单个输出,如果要输出分类效果的整体指标,最好的办法就是对每个类别做平均。Macro Average,Weighted Average,Micro Average对应不同的平均方法。
# 3.Macro Average
Macro Average是直接对各指标求和求平均。
在处理不平衡数据时,可以使用Macro Average衡量算法的效果。
# 4.Weighted Average
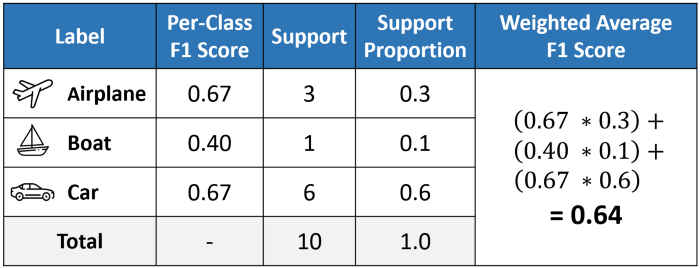
support即某类别数据的实际数量,support proportion即某类别数据占总数据的比例,Weighted Average的计算方式为:
如果处理不平衡数据时,但需要更多考虑算法在数据量较多的类别数据上表现效果,可以使用加权平均Weighted Average。
# 5.Micro Average
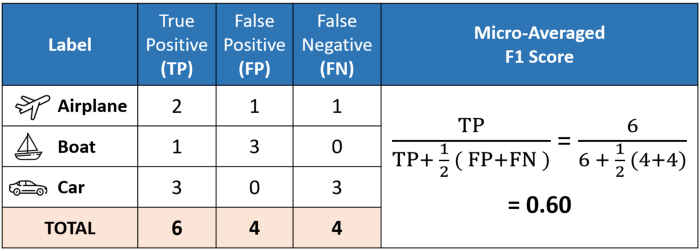
其等同于accuracy列对应的f1-score。在处理平衡数据时可以考虑使用Micro Average.