# 1.meshgrid用法
根据输入的x,y,z, ...向量生成xv, yv, zv, ...的坐标矩阵,其中xv, yv, zv同shape,表示每个点在x,y,z维度上的坐标。
numpy.meshgrid(*xi, copy=True, sparse=False, indexing='xy')
入参:
x1(N), x2(M), ...是K个一维数组,表示网格在每个轴上的坐标copy: 返回的结果是x1,x2,...中元素的引用,还是复制sparse: 如果为True为了节省内存会返回一个稀疏矩阵indexing:xy笛卡尔坐标的坐标矩阵,参考像素坐标,元素位置与正常数组不同,ij数组形式
返回值:
- 返回
K个shape为NxMx...的数组,表示NxM个点每个点在每个轴上的坐标
- 返回
# 2.meshgrid示例
index参数
import numpy as np
import matplotlib.pyplot as plt

nx = 4
ny = 2

x = np.linspace(0, 1, nx)
y = np.linspace(0, 1, ny)
# xy 以笛卡尔坐标的形式生成,类像素坐标系, 故访问是j,i
xv, yv = np.meshgrid(x, y, indexing='xy')
print(xv.shape, yv.shape)
# (2, 4) (2, 4)
for i in range(nx):
    for j in range(ny):
        print(xv[j,i], yv[j,i])
# ij 以数组下标的形式生成,故访问是i,j
xv, yv = np.meshgrid(x, y, indexing='ij')
print(xv.shape, yv.shape)
# (4, 2) (4, 2)
for i in range(nx):
    for j in range(ny):
        print(xv[i,j], yv[i,j])
print(f"xv:{xv}\nyv: {yv}")
meshgrid的应用
import numpy as np
import matplotlib.pyplot as plt

nx = 4
ny = 2

x = np.linspace(0, 1, nx)
y = np.linspace(0, 1, ny)
# xy 以笛卡尔坐标的形式生成,类像素坐标系, 故访问是j,i
xv, yv = np.meshgrid(x, y, indexing='xy')
# xv, yv同shape,分别表示的是nx x ny个点每个点对应轴上的坐标
# 将xv, yv组成每个点(x,y)的形式
xv = np.expand_dims(xv,-1)
yv = np.expand_dims(yv,-1)
print(np.concatenate((xv,yv), axis=-1))
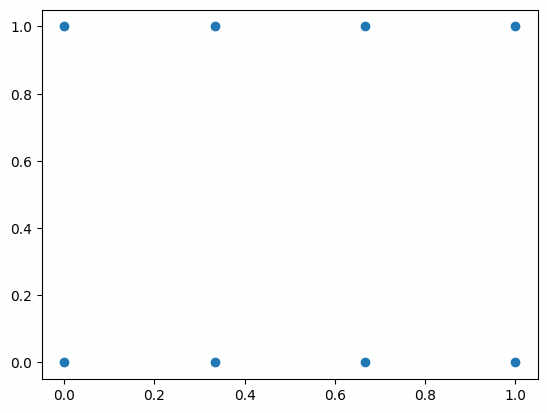
plt.scatter(xv,yv)
plt.show()

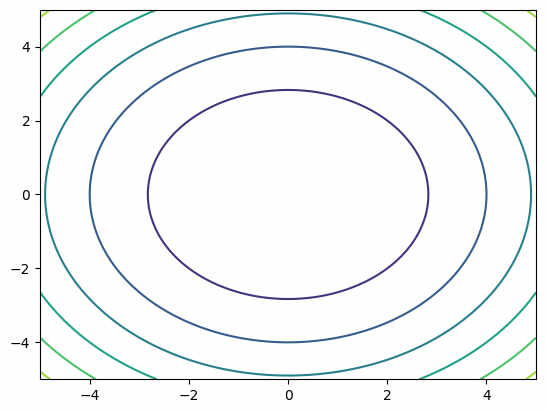
x = np.linspace(-5, 5, 100)
y = np.linspace(-5, 5, 100)
xx, yy = np.meshgrid(x, y)
zz = xx**2 + yy **2
plt.contour(xx, yy, zz)
plt.show()
ax = plt.axes(projection='3d')
ax.contour3D(xx, yy, zz, 50)
plt.show()
散点图grid共8个点:

2D等高线图:

3D曲面图:

# 参考资料
← jupyter配置远程访问 PIL常见问题 →